"we are extremely excited to offer our research studies, reports and software on the bloomberg professional system. we believe our trading discipline through the technical observation of our advanced bias, setup and trigger measures dovetails nicely with the advantage of knowing who is getting squeezed ." Phil Erlanger, CMT & president of Phil Erlanger Research Co., Inc.
erlanger Value Lines: powered by Bloomberg Professional
Erlanger Value Lines are designed to identify key levels for the intraday trader. These levels fall into two categories: Pivot, Support and Resistance and Range values. From a practical point of view, these levels act as targets and triggers for short-term trades. It is uncanny how these levels stop or turn back short-term price swings.
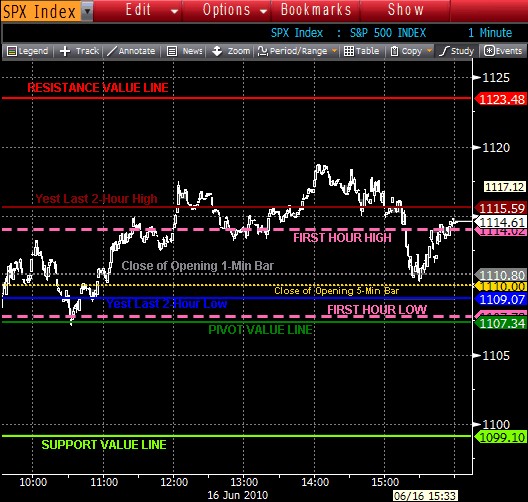
Support/Resistance levels are re-calculated each day based upon data from the previous trading day. There are three lines in this category: support (light green), resistance (red) and pivot (dark green.)
Range values include the final 2-hour high and final 2-hour low from the previous day's trading, the close of the 1 minute and 5 minute opening bars and the first hour high and low.
erlanger Value Lines: positive bias strategy
If price moves above the red Resistance value line, then the bias turns positive:
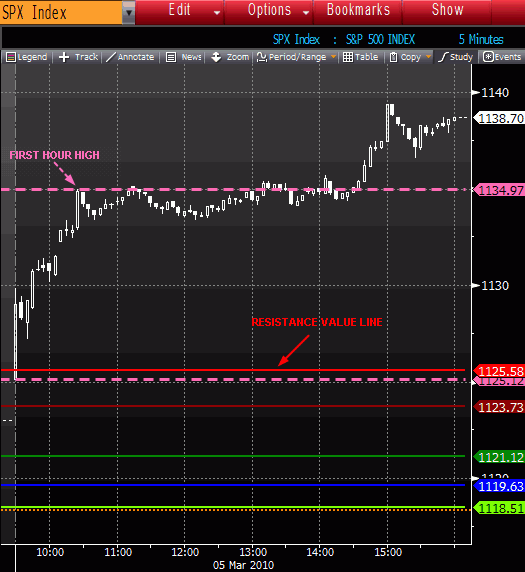
In the above case, the market opened above the red resistance level and remained above this key level all day. Also, if price breaks above the first hours high, the bias turns positive.
erlanger Value Lines: Negative bias strategy
If price moves below the green Support value line, then the bias turns negative:
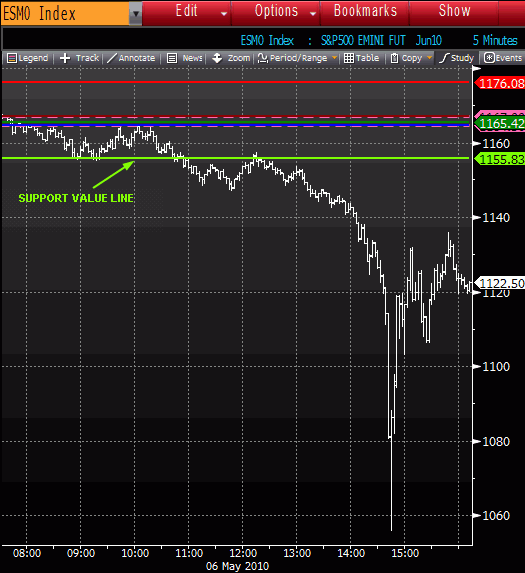
A negative bias reflects times when only short trades are considered. Early in trading on May 6, 2010 the S&P futures contract slipped below the pre-market first hour low, and then below the regular session green support level. Around mid-day the latter was tested as resistance, followed by an aggressive sell-off.
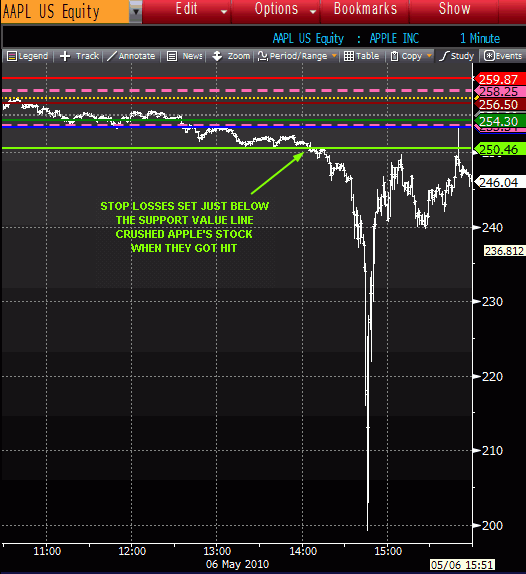
Value lines work intraday for stocks as well:
erlanger Value Lines: neutral bias and target strategy
If price remains within the green Support and red Resistance value lines, then the bias is neutral. If price remains within the first hour high and low value lines, then the bias can also be viewed as neutral. This is especially tru if the first hour range is inside the range set by the support and resistance value lines:
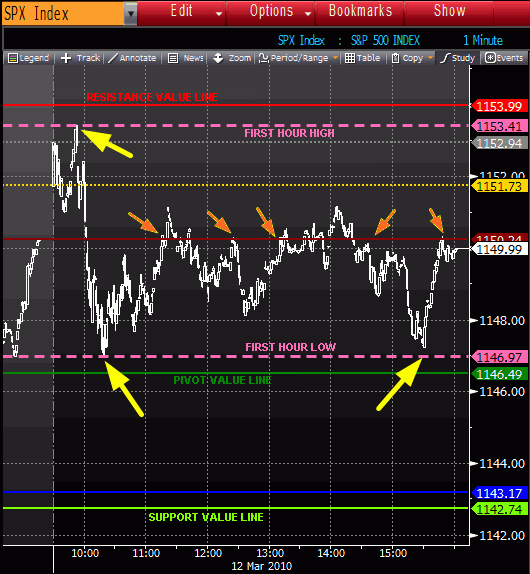
A neutral bias reflects times when both long and short trades may be considered or (depending on the traders style) a time for no trading. All of the trading on March 12, 2010 was contained within the first hour's high and low, indicating range trading tactics. A lot of time (see smaller orange arrows) was spent working at defining the prior day's last two hour high as resistance.
All Erlanger Value Lines can be used as short term target levels. This is especially true if a few are clustered together. In the above chart there are three cases (see large yellow arrows) where price turned at clustered EVL lines... the first was at a cluster of the first hour high and the red resistance level, two were at a cluster of the first hour low and the dark green pivot level.
Warranties,
Disclaimers & Legal Rights || Risk
Disclosure || Earnings
Disclaimer
Terms of
Service || Privacy
Policy
