"we are extremely excited to offer our research studies, reports and software on the bloomberg professional system. we believe our trading discipline through the technical observation of our advanced bias, setup and trigger measures dovetails nicely with the advantage of knowing who is getting squeezed ." Phil Erlanger, CMT & president of Phil Erlanger Research Co., Inc.
erlanger Volume swing: volume often precedes price
The Erlanger Volume Swing (EVS) index is a ratio between up and down volume. In the EVS, the total volume for a given day is divided into two portions according to the position of the close between the day's true high - the higher of today's high and yesterday's low - and the true low - the lower of today's low and yesterday's high. True high and true low eliminate the problems of limit days and more suitably distribute volume on gap days. The separate up volume and down volumes are then smoothed exponentially.
The Erlanger Volume Swing Helps to Confirm Other Signals
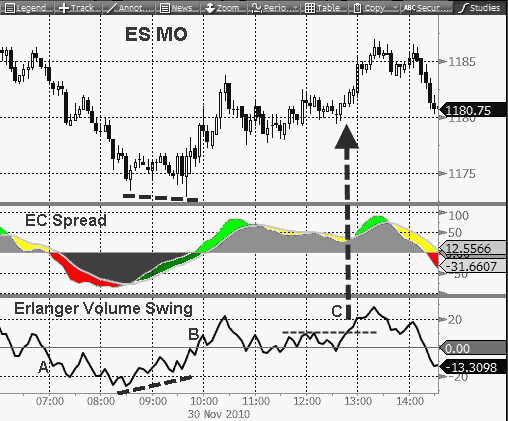
Setup strategies are patterns in an indicator that typically precede a change in price. The Erlanger Volume Swing index is an oscillator. As such, the user looks for higher highs and lower lows in price to be confirmed by the EVS. When non-confirmations occur, trend changes are more likely forthcoming. For instance, a failure of the EVS to confirm a higher high in price is a setup for a downside reversal. When the EVS fails to confirm a lower low in price, a setup for a rally reversal is in order. Once a setup is observed, the EVS can also be used as a trigger into a trade.
Trigger strategies are patterns in an indicator that typically point to a time to execute a trade. Triggers are best executed following appropriate setup patterns. An EVS trigger for a long trade is made when the EVS moves above the zero level. A trigger for a short trade is made when the EVS moves below the zero level:

In the above chart, we have added the EVS to the chart of the S&P 500 e-mini futures contract. At point A, the EVS triggers into a sell position by dipping below the zero line - well ahead of the EC Spread. Its a good idea to use a combination of trigger indicators, as is depicted here. One is not necessarily better than the other. The value is that these are representations of different criteria so when they agree, a case for the signal is therefore more valid. Point B is a buy signal in the EVS that slightly lags the buy signal in the EC Spread. Note the positive divergence of the EVS with price (dashed lines) leading up to point B. At point C, the EVS broke out to a higher reaction high before the market, indicating expanding positive volume ahead of the price action.
In the Bloomberg system the EVS requires a multiple security chart and the data series must include volume statistics. The other studies can be added as a single security chart. The EVS is the only Erlanger study that cannot be added as a single security chart.
Warranties,
Disclaimers & Legal Rights || Risk
Disclosure || Earnings
Disclaimer
Terms of
Service || Privacy
Policy
