"we are extremely excited to offer our research studies, reports and software on the bloomberg professional system. we believe our trading discipline through the technical observation of our advanced bias, setup and trigger measures dovetails nicely with the advantage of knowing who is getting squeezed ." Phil Erlanger, CMT & president of Phil Erlanger Research Co., Inc.
erlanger crossover and crossover spread: smooth signals
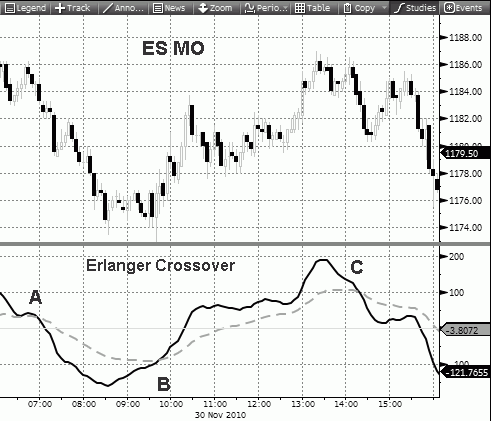
The Erlanger Crossover (EC) indicator is primarily a trigger indicator. Trigger strategies are patterns in an indicator that typically point to a time to execute a trade. The Erlanger Crossover uses true range technology to eliminate whipsaws while maintaining timely trigger signals:

The trigger mechanism in the Erlanger Crossover is a simple process of buying when the fast line (plotted as a solid line) rises above the slow line (plotted as a dashed line), and selling (or short selling) when the fast line moves below the slow line. As is the case with all triggers, it is helpful to have appropriate setup indications in place before acting upon such trigger indicators. In the above chart, the S&P 500 e-mini contract (ES MO) is plotted on a 5-minute basis, The Erlanger Crossover turns negative at points A and C, and positive at point B.
The EC Spread Measures the Momentum of the Erlanger Crossover
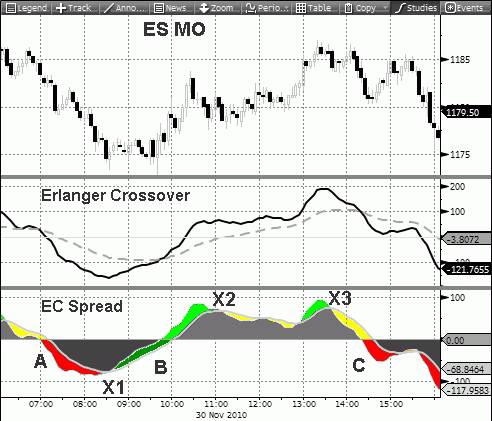
Notice that the Erlanger Crossover fast line turns direction substantially ahead of the actual crossover. This momentum of the Erlanger Crossover is at the heart of the EC Spread which is simply the difference between the Erlanger Crossover fast and slow lines of the Erlanger Crossover:

The EC Spread is a multi-use tool. It has the trigger information contained in the Erlanger Crossover, setup patterns that often precede price direction changes, and as a traders tool for money management.
The EC Spread also has its own signal line which acts to identify clear changes in the direction of the EC Spread (i.e. the momentum of the Erlanger Crossover.) The key indications of the EC Spread occur when the EC Spread moves through its signal line, and also when the EC Spread moves above or below its zero level. The latter is, of course, another way of depicting crossovers of the Erlanger Crossover, and as such is a trigger mechanism. The movement of the EC Spread through its signal line is an early warning that suggests a trend change in price. This use of the signal line is both a setup situation, but it also serves as a useful money management tool. In the above chart, point X1 shows an upturn of the EC Spread through its signal line a good time to exit, or pare down a short position. As a typical money management process, traders look for an early signal to take 50% of a position off of the table, and another signal to close out the entire position. In this case, point B could be the latter and it also serves as an entry trigger for a long trade. Point X2 serves as a money management signal to sell 50% of a long position place at point B, and either point X3 or C could close out the entire long position.
Warranties,
Disclaimers & Legal Rights || Risk
Disclosure || Earnings
Disclaimer
Terms of
Service || Privacy
Policy
