|
phil
erlanger research THE ART OF THE SQUEEZE PLAY |
|
|
|
|
Phil Erlanger Research presents Erlanger Chartroom tm - Bloomberg Edition |
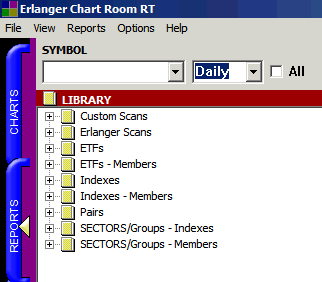
Chartroom Reports and ScansChartroom puts advanced technical analysis and quantitative research on your desktop. Whether you want to find those stocks ranked as attractive from a technical or "sentiment" point of view, or to follow the markets using state-of-the-art methodologies, the tools are here. Our “Library” section contains easy access to advanced reports and scans, Exchange Traded Funds and their components, indices and their components, pairs trading mechanisms and industry group and sectors and their components:
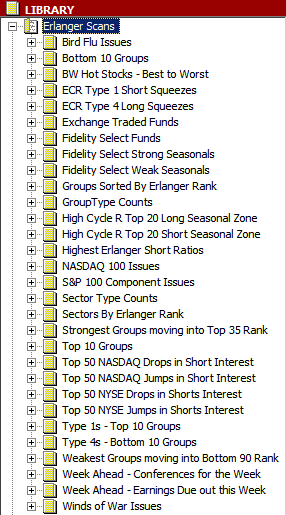
Let’s take a closer look at the Erlanger Scans within Chartroom’s Library section:
These reports and scans are updated overnight (or weekly/biweekly for certain reports) and by simply clicking on these the user sees the report or scan in the workspace. Click on a symbol in the report and the chart portion of the workspace changes to that symbol. At any one time the workspace can hold in memory a chart layout and a report layout. The side tabs in Chartroom make it easy to move back and forth between the two.
We are constantly adding to these reports and scans, keeping up with the demands of our clients and the focus of the markets. Rankings of a variety of index components are one click away. Check out which of Fidelity’s Select Funds are seasonally strong or weak over the next 40 trading days. Find short squeezes or long squeezes, strong and weak industry groups and sectors, current trend direction of stocks and ETFs, the best stocks from the best industry groups, the worst stocks from the worst industry groups… and so much more.
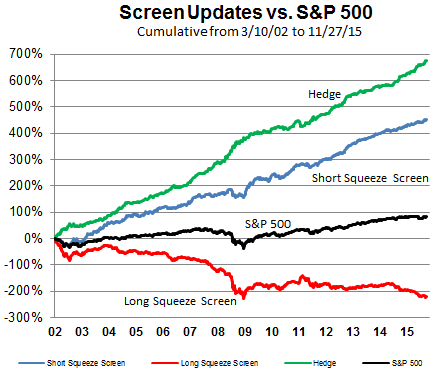
At the beginning of each week, we run two special screens of large cap issues – one that finds short squeezes and the other long squeezes. See the sentiment tab for more details on what a squeeze play is all about. We started these screens in March of 2002. The chart below is the performance of these screens as of this writing:
Since we began publishing these screens (2414 calendar days ago), the hedge has gained 346.40% compared to a -8.23% change in the S&P 500. The Short Squeeze screens (blue line) cumulatively rose 164.25% while the Long Squeeze screens (red line) cumulatively fell -182.15%. These numbers are calculated by averaging the weekly percentage changes of the stocks in each screen and do not take commissions into account.
This is a PDF sample of the Long Squeeze screen from late September 2008.
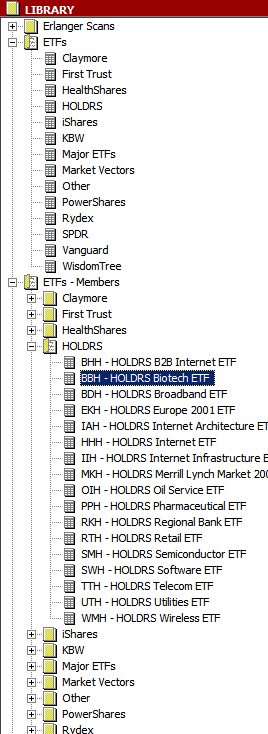
One of the more interesting things our users can do is track our rankings of the component issues of their favorite Exchange Traded Fund:
As the above picture shows, the user can choose to examine a particular ETF from a family of ETFs by drilling down into one of the ETF families listed in the “ETFs” book (the second item in the Library.) To see the member stocks within an ETF, the user can choose from the third book in the Library which is “ETFs – Members” and select an ETF from one of the ETF families. In the above picture the BBH Biotech Holdrs ETF is selected. This is a sample PDF of this report.
|
Privacy Policy | Terms of Service | Earnings Disclaimer |
Site Menu  |
|
 |
|
Site Search  |
|
 |
|
© Phil Erlanger Research Co., Inc., 2024.
All Rights Reserved.


