White Paper
Analysis of Erlanger Data Series:
Displaced Moving Averages
By: Philip B. Erlanger, CMT
The DMA channel is a multi-purpose indicator. It can be used as a trend direction tool, a trigger for long and short trades, or as a bias indicator. It can even be used as a setup indicator.
The Displaced Moving Average Channel (DMA) is one of those indicators that are simple in its construction, but so powerful in its application. A "displaced" moving average (DMA) is simply a normal moving average shifted to the right or left. A displaced moving average can be computed based upon a stock's closing price, high price and/or low price. The DMA Channel involves DMA averages of the high and low values of a time series. These averages form a channel that make clear any trend change event, as well as the strength of a trend underway. The DMA channel can be used on any time interval, but there must be price high and price low data available for each interval.
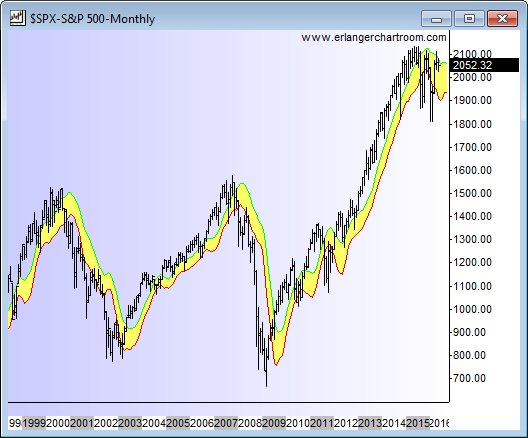
A positive bias reflects times when only long trades are considered. If price moves above the DMA Channel, then the bias is positive. However, using the DMA Channel as a bias should be confined to intervals larger than one uses for triggers. For instance, if you are trading an index, use triggers based on daily data, but use weekly or monthly data to determine the bias:
Looking at the SPX with the DMA channel on a monthly basis is our preferred method of determining bias. The benefit of establishing bias in this way can be seen when traders concentrate on long trades while the S&P 500 index maintains a positive posture above its monthly DMA channel and hedged/short trades when the S&P 500 index maintains a negative posture below its monthly DMA channel. Using the S&P 500 as a bias benchmark helps the portfolio manager deploy disciplined equity strategies in sync with the overall market behavior.
As the table below demonstrates, navigating the S&P 500 using its monthly DMA channel as described above delivers added value:
The action of the stock market during this period (since the start of 2000) has had many swings, both up and down. Many portfolio managers and traders suffered during the declines of 2000-to-2003 and 2008-to-March 2009. Billions of dollars were lost. Imagine how much of that money would have been preserved if those portfolio managers traded with the discipline of this “big picture” bias.
The S&P 500 is only one index. Looking at all the major indices and their “big picture” bias signals is a prudent way to confirm any one index signal:
If the majority of indices sport a “big picture” bias in the same direction, that bias is confirmed.
The monthly DMA channel can be applied to individual stocks as well.
There are times the discipline of the monthly DMA channel can help the portfolio manager avoid the temptation of perceived value as a stock declines into the abyss.
A timely trigger is to buy when price moves above the DMA channel and to short when price moves below the DMA channel:
It is important to use the interval appropriate for the type of trading you do for triggers and, as mentioned above, for bias determination. If you trade on weekly data, use weekly DMA channels for triggers and monthly data for bias determination.
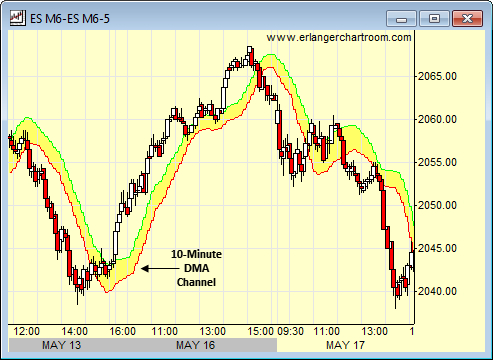
If you trade on 5 minute bars, a 10-minute DMA channel can serve as both a bias and trigger indicator.
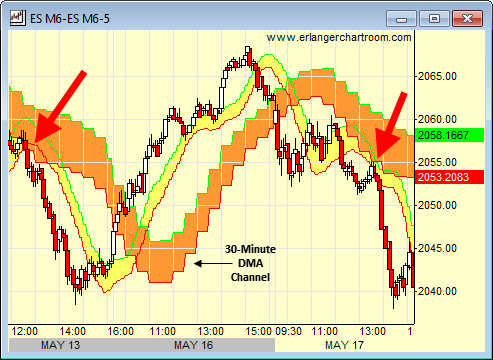
Overlaying a 30-minute DMA Channel can also point out significant resistance and support definitions. In the case of the above chart, the two red arrows point to separate instances when the price action to get through both the 10 and 30-minute DMA Channels. The following lower reaction lows triggered significant and immediate downside action.
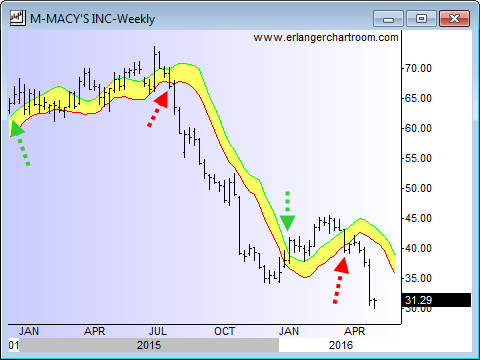
The DMA channel can also serve as a setup measure. For example, if there is an upturn in price, we look for price to stay above the DMA channel. We are also concerned with the slope of the channel. The steeper the slope of the DMA channel, the more powerful the advance phase. This brings us to the heart of the matter. Stocks generally transit from advance phase to decline phase and back again to another advance phase - so on and so forth. How the current phase unfolds can set up the tone of the next phase if an advance phase is mediocre, the next decline phase is more likely to be nasty. If a decline phase in mild, this could setup a relatively stronger move in the next advance phase. The DMA channels slope helps in monitoring the tone of the current advance phase.
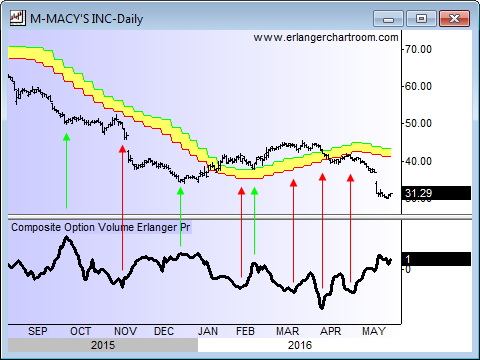
Adding in sentiment measures like our Erlanger Options ratios, these setups become clear. In the above chart, Macy's shares starts out below its weekly DMA channel - a negative bias situation. The first green arrow highlights excessive put activity relative to call activity, a point at which contrary opinion might suggest a rally. However, no meaningful rally ensued - though a pause in the decline did occur. After drifting a bit, the Erlanger Options ratio dropped off considerably, setting up a sentiment picture of "too many bulls" at the second arrow (colored red). At this point the price action was still below the DMA channel and as such was proof that Macys had little going for it in that it was unable to exploit the earlier presence of negative bettors. As the stock price declined it picked up momentum on the downside. In early 2016 Macy's did move above its weekly DMA channel - a positive shift in bias. The slope of the DMA channel remains in a "mild" uptrend for a while, and as the options traders became more bullish (red arrows), the price slipped back below its weekly DMA channel.
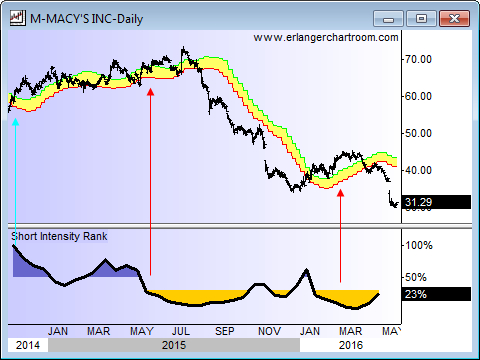
Other independent sentiment indicators also can add value. The Erlanger Short Intensity Rank shows that early on short sellers were being squeezed while Macy's stock moved above its weekly DMA channel (green arrow). Around May of 2015 the short interest dwindled, indicating that short sellers had capitulated. That is a riskier posture from a sentiment point of view. Price action continued higher into July, but the deteriorated sentiment picture suggested that this was a mature advance. With the breakdown below the weekly DMA channel, price was especially vulnerable due to the sentiment situation. With the exception of one brief rally in Q1 of 2016 (when short sellers briefly made some bets) Macy's stock struggled.
The DMA channel is designed to offer discipline to the portfolio manager. If a stocks bias, setups and triggers discussed above move contrary to a PM's idea as to where that stock should be headed, at the very least a re-evaluation of that stock is in order. For the value strategist, picking stocks that emerge from weak setups to strong setups is a discipline that can add value (pun intended).